Sustainable Resource Use
Water Resource Management
Basic stance
As a global business entity, the Nidec Group has set targets for water resource and risk management since fiscal year 2004, and has been steadily working to monitor water withdrawal and discharge, as well as the impact on surrounding areas and water source. We recognize that as our business scale expands, including through M&A, our impact on water resources increases and so does its importance of managing them. Going forward, we will continue to promote efficient use of water resources throughout the company, advance efforts to conserve, reuse and recycle water, and work on activities to reduce water risks.
Target
In the Seventh Mid-term Environmental Conservation Plan, we have set a reduction target for water withdrawal and are making steady progress with specific water risk reduction activities. In addition, we have set a target to "Complete 100% of water risk assessment" as one of our materiality KPIs. Beyond just monitoring the status of water withdrawal and discharge, we aim to identify water risks in each country and region and evaluate their business impact. Based on these results, we will formulate a water risk assessment process to plan and implement risk reduction measures, thus promoting sustainable water resource management.
The seventh mid-term environmental conservation plan
| Item | Three-year targets (FY2025 goals) |
|---|---|
| Reducing water withdrawal *1 | Reduce the amount of water withdrawals intensity per unit of consolidated net sales by 3% compared to the fiscal year 2022 |
| Handle water risks *2 | Complete 100% of water risk assessments |
Materiality: Contribute to environmental sustainability
| Theme to be addressed | KPI (FY2025) |
|---|---|
| Handle water risks* | Complete 100% of water risk assessments |
*1 Number of sites where data was collected: FY2022 - 225 sites; FY2023 - 228 sites; and FY2024 - 224 sites.
(The data was collected from manufacturing sites with 100 or more employees.)
*2 Scope: All sites (manufacturing, R&D, and sales/administrative sites), covering 100% of consolidated net sales.
Achievements
Water Withdrawal and Discharge
Total water withdrawal for fiscal year 2024 was 8,194,000 m3, decreased by 5.7% in intensity per unit of consolidated net sales compared to fiscal year 2022. Water withdrawal from Drinking water and industrial water, underground water and rainwater did not have a significantly change from the previous fiscal year. However, water withdrawal from rivers, ponds, lakes and marshes exceeded the prior fiscal year’s due to increase in production volume at sites use these water sources. Total water discharged for fiscal year 2024 was 6,465,000 m3. Water discharged to sewage, rivers, ponds, and lakes and reservoirs exceeded the previous fiscal year’s. One of the Nidec Group’s site locates in a snowbelt area, and uses water to melt accumulated snow. Increased in this area’s snowfall this fiscal year compared with the prior one led to increase water discharged.
Water withdrawal by water source, discharge by destination, and recycled/reused amounts
| Item | Unit | FY2022 | FY2023 | FY2024 | Comparison to base year *2 | ||
|---|---|---|---|---|---|---|---|
| Water withdrawal | Total water withdrawal | 1,000 ㎥ | 8,689 | 8,179 | 8,194 | 5.7% reduction | |
| Water withdrawals intensity per unit of consolidated net sales *3 | 1,000㎥/billion yen | 3.896 | 3.485 | 3.143 | 19.3% reduction | ||
| Drinking water and industrial water | 1,000 ㎥ | 7,142 | 6,528 | 6,552 | 8.3% reduction | ||
| Groundwater | 1,000 ㎥ | 1,233 | 1,399 | 1,344 | 9.0% reduction | ||
| Surface water:Rivers,ponds,lakes, marshes | 1,000 ㎥ | 308 | 244 | 290 | 5.8% reduction | ||
| Rainwater | 1,000 ㎥ | 8 | 8 | 8 | 0% | ||
| Water for quarry collected from quarry pits | 1,000 ㎥ | 0 | 0 | 0 | - | ||
| Sea | 1,000 ㎥ | 0 | 0 | 0 | - | ||
| External draining | 1,000 ㎥ | 0 | 0 | 0 | - | ||
| Water discharge | Total water discharge | 1,000 ㎥ | 6,637 | 6,341 | 6,465 | 2.6% reduction | |
| Off -site water treatment:Sewage | 1,000 ㎥ | 5,716 | 5,030 | 5,061 | 11.5% reduction | ||
| Surface water:Rivers, ponds, lakes | 1,000 ㎥ | 832 | 1,225 | 1,313 | 57.8% increase | ||
| Sea | 1,000 ㎥ | 89 | 86 | 91 | 2.2% increase | ||
| Draining to the underground and wells | 1,000 ㎥ | 0 | 0 | 0 | - | ||
| Draining for beneficial and other usages | 1,000 ㎥ | 0 | 0 | 0 | - | ||
| Recycled and reused amount | 1,000 ㎥ | 266 | 181 | 382 | 43.6% increase | ||
*1 Number of sites where data was collected: FY2022 - 225 sites; FY2023 - 228 sites; and FY2024 - 224 sites.
(The data was collected from manufacturing sites with 100 or more employees.)
*2 Comparison to base year: This refers to the comparison of data from the latest year against the baseline year, 2022, as defined in the Seventh Mid-Term Environmental Conservation Plan.
*3 Intensity per unit of consolidated net sales : The amount of water withdrawal divided by the Nidec Group’s consolidated net sales.
Water risk assessment
In fiscal year 2023, to assess the impact of water risks on its business operations, the Nidec Group used the Aqueduct Water Risk Atlas of the World Resources Institute (WRI) and the Water Risk Filter of
the World Wide Fund for Nature (WWF) to select “flooding” and “water scarcity” out of five key areas - “flooding”, “water scarcity,” “water quality”, “water supply fluctuations” and
“regulations/reputation” - as significant risks that have a major impact on the businesses. A simple assessment based on these conditions revealed that 38 sites are at risk of flooding, while another 40
sites are at risk of water scarcity. We assessed these sites based on their water withdrawal, discharge and sales, etc., to identify a total of 12 sites (seven sites at risk of flooding, and five sites at
risk of water scarcity) as sites with high water risks.
In fiscal year 2024, we refined our water risk assessments to more accurately reflect local conditions by conducting in-depth analyses of water-related data and interviews. As part of our detailed
analysis on sites with high flooding-related risks, we used the Aqueduct Floods of World Resources Institute (WRI) to find that two out of seven sites are not located in a high water risk areas. Thus, a
total of 10 sites (five sites at risk of flooding, and five sites at risk of water scarcity) were identified as high-water-risk sites. We had interviews with them individually:
In anticipation of flooding-cased water immersion, have in place a business continuity plan (BCP), including preparations to transfer to a factory in a neighboring country with similar
production facilities; and, to counter water scarcity-related risks, they have secured an alternative withdrawal resource (a well) in anticipation of potential water restrictions. We completed water
risk assessment after confirming the results of the detailed analysis on sites identified as high-water-risk sites, and that they have measures in place to mitigate water risks.
Business impact with flood risk
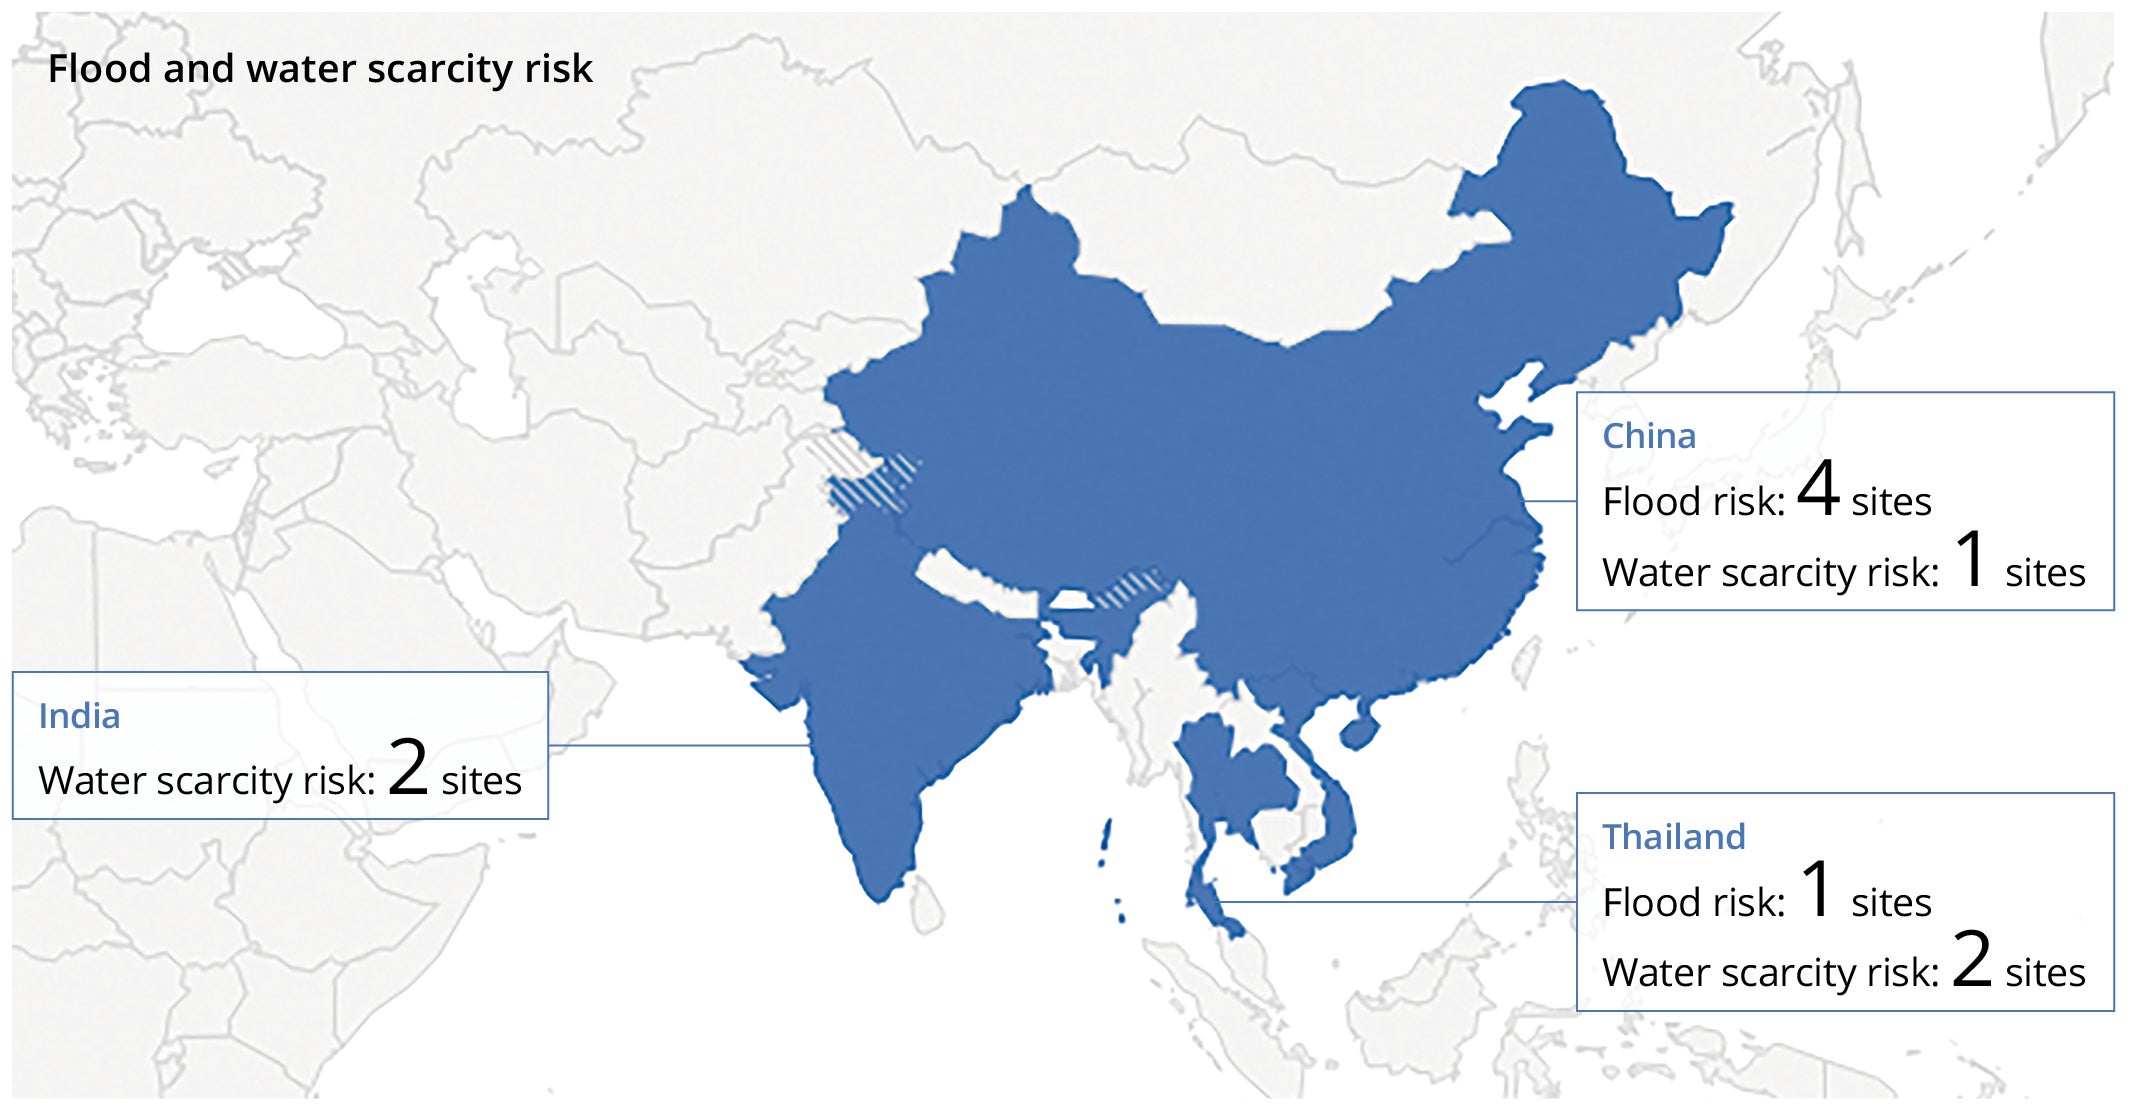
Using as reference the guideline on the TCFD’s physical-risk assessment by Japan’s Ministry of Land, Infrastructure, Transport and Tourism, the Nidec Group calculated and evaluated the financial impact from fixed-asset and inventory damage and business suspension of the five sites at high risk of flooding (China: 4 sites, Thailand: 1 site) to be 7.7 billion yen.
Understanding water consumption in water scarcity areas
We understand the water consumption for sites which located in areas with water scarcity risk. For the five sites identified as having high water scarcity risks (China: 1 site, Thailand: 2 sites, India: 2 sites), the total water withdrawal was 1,039,000 m3 in fiscal year 2024. This is equivalent to 12.7% of the NIDEC Group's total water withdrawal.
Water consumption for areas with water scarcity
| Section | Unit | FY2022 | FY2023 | FY2024 |
|---|---|---|---|---|
| Water withdrawal | 1,000㎥ | 1,100 | 949 | 1,039 |
| Water discharge | 1,000㎥ | 996 | 842 | 926 |
|
Amount of water recycled
and reused |
1,000㎥ | 101 | 125 | 61 |
Investment in Research and Development to Mitigate Water-Related Risks
In fiscal year 2024, Nidec corporation invested 0.26 million yen in research and development to aim at mitigating water-related risks.
Unit: million yen
| Item | FY2023 | FY2024 |
|---|---|---|
| Investment in Research and Development to Mitigate Water-Related Risks | 18 | 0.26 |
* Nidec Corporation’s sites in Japan and 10 overseas subsidiaries.
Water-related legal violation
In fiscal year 2024, no Nidec Group sites were in violation of any laws, regulations, or standards regarding water consumption and water quality.
| Item | Unit | FY2023 | FY2024 |
|---|---|---|---|
| Number of incidents of non-compliance with water quality/quantity | Case | 0 | 0 |
Actions
We believe that reducing water withdrawal will mitigate the water related- risks to our business activities and its likelihood. The Nidec Group aims to reduce water withdrawal by 3% in intensity per unit of consolidated net sales annually. To achieve this, our factories and business sites have implemented various measures such as the introduction of new equipment to reduce water withdrawal and promote water reduction, reuse and recycling for water resources.
Reduction, Reuse, and Recycling of Water
Nidec Powertrain Systems (Zhejiang) Corporation uses the bulk of water to cooling towers, which serve to cool factory machinery. By optimizing the temperature management of chillers, cooling towers, and air handling units to curb evaporation, the factory reduced by 17.6% for fiscal years water withdrawal compared to fiscal year 2022.
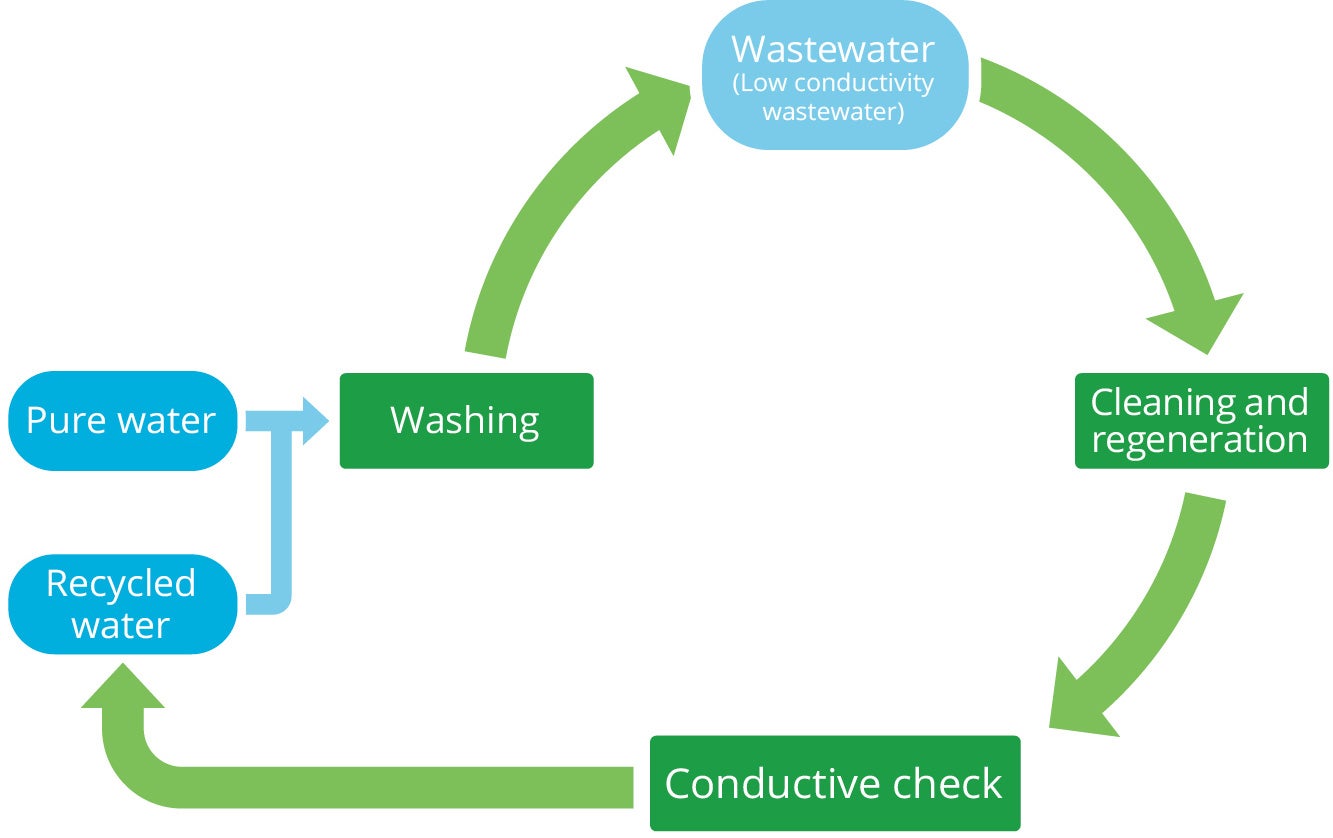
Nidec Precision (Zhejiang) Co.,Ltd. actively promotes reuse and recycling of water resources. In fiscal 2023, the factory achieved a water recycling rate of over 60%.
Introducing new equipment to reduce water withdrawal
Our automotive motors factory in the city of Dalian, China, launches measures to curb its constantly operating cooling equipment’s energy use to ensure a stable manufacturing environment despite a rise in the external temperature in summer. The factory introduced “cooling-storage equipment,” which uses its cooling device to generate and store cold water during the night, when electricity prices are lowest. Since its installation, it has shortened the cooling equipment’s operating hours and curbed the evaporation of the factory’s cool circulating water. This action led to a reduction in water withdrawal by 0.4% compared to the fiscal year 2023 May-August, when its cooling equipment needed to be on constantly. Although the reduction rate is small, this measure contributed to reducing the factory’s electricity consumption for the operation of its cooling equipment, curbing the factory’s CO₂ emissions by 1.6%.
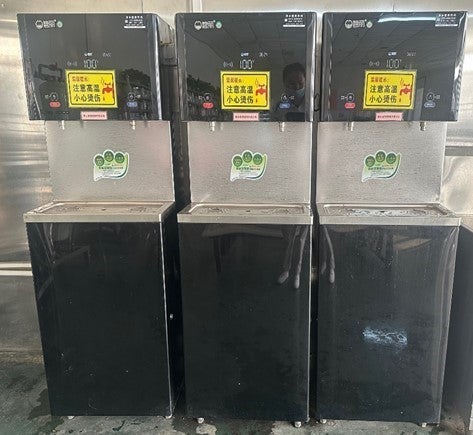
By introducing water-saving water servers, Nidec Instruments (Zhejiang) Corporation successfully reduced water withdrawal in fiscal year 2023 by 2.86% compared to fiscal year 2022.