Environmental Performance
Environmental Performance 2016
Since FY2004, Nidec has been making and promoting for implementation a three-year medium-term environmental conservation plan, and the fifth one was launched in FY2015. In the focus areas of “greenhouse gases (CO2),” “electricity,” “water,” and “waste disposal” in our business activity-based environmental burden reduction, we aim to reduce our three-year average by 3% on an intensity basis* from base year FY2015 levels.
*Intensity basis: Per employee for nonproduction sites, and per US$1,000 of sales for production sites.
This plan covers Nidec Group companies’ head offices, R&D sites, and production sites inside and outside Japan.

 |
 |
|
|
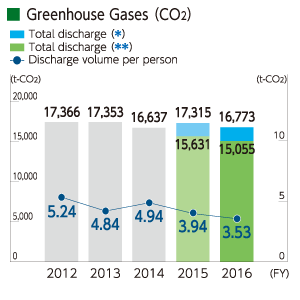
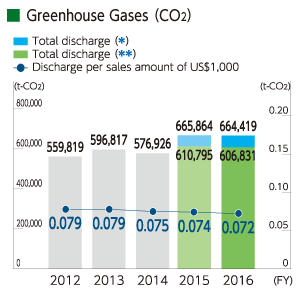
The total amount of CO2 discharge decreased by approximately 3.1% from the FY2015 level and by approximately 8.5% on an intensity basis, mainly due to decreased electricity usage. |
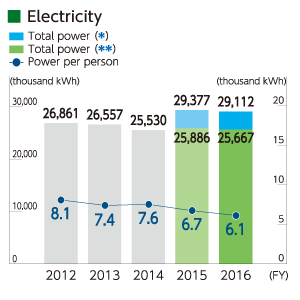
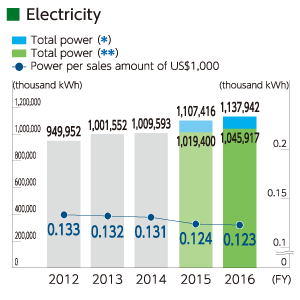
Despite an increase in the number of employees, the total amount of electricity used decreased by approximately 0.9% from the FY2015 level and by approximately 8.5% on an intensity basis, due to site closures elimination and consolidation of business sites and their power-saving efforts.
|
|
 |
 |
|
|
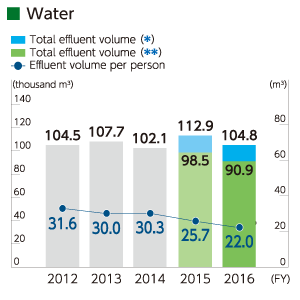
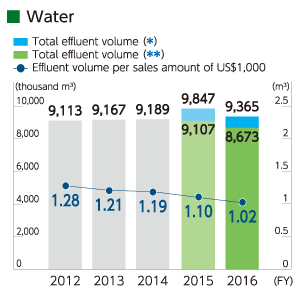
Though the number of employees increased from the FY2015 level, the amount of water discharge decreased both in the total amount and on an intensity basis due to site closures and consolidation of business sites and their water-saving efforts. |
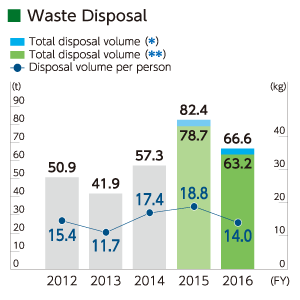
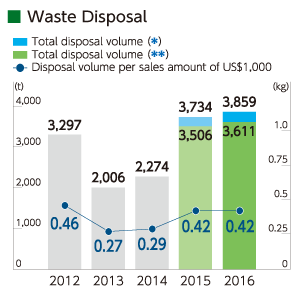
Though FY2015, the previous fiscal year, saw an increase in the amount of waste disposal due to such events as one-time disposal of office supplies, the final amount of waste disposal for this fiscal year decreased by approximately 19.5% from the FY2015 level and significantly by approximately 25.3% on an intensity basis, due to steady waste reduction efforts. |
* (additional in-scope sites under ECP5) ** ( in-scope sites under ECP4)

 |
 |
|
|
Though power usage increased by approximately 2.7% due to such factors as introduction of new equipment and changes to production lines, the total amount of discharge decreased by approximately 0.2% from the FY2015 level and by approximately 3.1% on an intensity basis due to a significant reduction in the total fuel usage by some of our large business sites. |
Though the total amount of electricity used increased by approximately 2.7% from the FY2015 level, it decreased by approximately 0.2% on an intensity basis. Of the total amount of electricity, renewable energy (generated by photovoltaic power generation) accounted for approximately 0.3%.
|
|
 |
 |
|
|
The total amount of water discharge decreased by approximately 4.9% from the FY2015 level and by approximately 7.6% on an intensity basis, due to lower washing water usage after a volume reduction in small PC motor production, and efficient water usage after the introduction of new equipment. |
The final amount of waste disposal increased by approximately 3.0% from the FY2015 level and by approximately 0.4% on an intensity basis due to a production volume increase at some production sites, and disposal of items that became unnecessary during factory transfer preparations. |
* (additional in-scope sites under ECP5) ** ( in-scope sites under ECP4)
Number of business sites covered in the environmental conservation plan
The fifth medium-term environmental conservation plan covers companies that were part of the Nidec Group as of FY2015, the base year of the plan.
